The average American household spent $818 on housekeeping supplies in 2023, according to the Bureau of Labor Statistics Consumer Expenditure Survey. That number climbed to $971 for two-person households in 2024. But here’s what most budget guides miss: cleaning supply costs and major appliance spending are connected in ways that directly affect your bottom line.
This guide breaks down the actual BLS and FRED data on household cleaning and appliance spending, shows you how these costs vary by household size, and reveals practical strategies to reduce both categories without sacrificing cleanliness or appliance longevity.
Let’s start with the real numbers. The BLS Consumer Expenditure Survey tracks what American households spend across dozens of categories. Their “housekeeping supplies” category includes:
This category doesn’t include professional cleaning services, appliance repairs, or specialized maintenance equipment.
According to Statista’s analysis of BLS data, the average consumer unit spent $818 on housekeeping supplies in 2023. That’s roughly $68 per month.
But averages can be misleading. Your actual spending depends heavily on household size, composition, and maintenance habits.
The Federal Reserve Bank of St. Louis (FRED) tracks consumer expenditure data broken down by household composition. Here’s what the 2024 numbers look like:
| Year | Annual Spending | Year-over-Year Change |
|---|---|---|
| 2024 | $971 | +13.0% |
| 2023 | $859 | -0.3% |
| 2022 | $862 | +1.4% |
| 2021 | $850 | -3.1% |
| 2020 | $877 | (baseline) |
Source: FRED Series CXUHKPGSUPPLB0504M
The 13% jump from 2023 to 2024 reflects both inflation in cleaning product prices and increased spending on premium products.
| Year | Annual Spending | Year-over-Year Change |
|---|---|---|
| 2024 | $614 | +8.9% |
| 2023 | $564 | -1.6% |
| 2022 | $573 | -0.5% |
| 2021 | $576 | +3.0% |
| 2020 | $559 | (baseline) |
Source: FRED Series CXUHKPGSUPPLB0610M
Single-person households spend less in absolute terms, but more per capita. A person living alone spends $614/year on cleaning supplies, while each person in a two-person household averages about $485.
| Year | Annual Spending | Year-over-Year Change |
|---|---|---|
| 2024 | $1,287 | +3.2% |
| 2023 | $1,247 | +16.8% |
| 2022 | $1,068 | -17.2% |
| 2021 | $1,290 | -22.2% |
| 2020 | $1,659 | (peak) |
Source: FRED Series CXUHKPGSUPPLB0607M
The pandemic spending spike in 2020 stands out here. Larger families increased cleaning product purchases dramatically during 2020, with spending gradually normalizing since then.
A Verve Credit Union analysis of Statista survey data found:
Post-pandemic cleaning product spending remained 34% higher than pre-pandemic February 2020 levels, suggesting lasting changes in household cleaning habits.
While cleaning supplies represent recurring monthly costs, major appliances involve large, infrequent purchases. The BLS defines major appliances as:
Two-Person Households:
| Year | Annual Spending |
|---|---|
| 2024 | $390 |
| 2023 | $450 |
| 2022 | $433 |
| 2021 | $524 (pandemic peak) |
| 2020 | $375 |
Source: FRED Series CXUMAJAPPLLB0504M
Households with 3+ Earners:
| Year | Annual Spending |
|---|---|
| 2024 | $588 |
| 2023 | $533 |
| 2022 | $607 |
| 2021 | $686 |
| 2020 | $574 |
Source: FRED Series CXUMAJAPPLLB0707M
Higher-income households spend more on appliances – partly due to purchasing premium models and partly due to more frequent replacements.
The home appliance industry provides context for individual spending:
Sources: Statista Home Appliance Industry, Consumer Affairs Statistics
When appliances fail, replacement costs can strain household budgets significantly. Here’s what HomeAdvisor and HomeGuide report for 2024-2025 prices:
| Appliance | Low | Average | High |
|---|---|---|---|
| Refrigerator | $430 | $1,500 | $10,600 |
| Washing Machine | $445 | $1,200 | $2,300 |
| Clothes Dryer | $445 | $1,100 | $2,100 |
| Dishwasher | $330 | $800 | $1,900 |
| Range/Stove | $410 | $1,200 | $7,500 |
Kitchen Appliance Package (refrigerator, microwave, range, dishwasher): $2,100 – $5,400
Washer + Dryer Set: $1,100 – $2,000
These aren’t small purchases. A kitchen renovation requiring full appliance replacement could cost $5,000 or more for mid-range models.
Understanding appliance lifespans helps you plan for replacements and decide whether repairs make financial sense.
| Appliance | Expected Lifespan | Replace If Repair Exceeds |
|---|---|---|
| Refrigerator | 12-15 years | $600 |
| Washing Machine | 10-12 years | 50% of replacement cost |
| Dishwasher | 9-12 years | 50% of replacement cost |
| Clothes Dryer | 10-13 years | 50% of replacement cost |
| Range/Oven | 13-15 years | 50% of replacement cost |
Sources: AARP Appliance Lifespan Guide, Mr. Appliance
The 50% Rule: If repair costs exceed half the replacement cost, buying new usually makes more sense. For refrigerators specifically, repairs over $600 typically justify replacement.
Here’s a concerning finding: according to an American Home Shield survey from January 2025:
When your refrigerator dies unexpectedly and you’re looking at a $1,500 replacement, that lack of preparation hits hard.
Here’s what most household budget guides miss: your cleaning habits directly influence how long appliances last and how much you spend maintaining them.
Many appliances get replaced because of appearance, not mechanical failure. Stovetops with burned-on residue, scratched surfaces, and permanent staining often prompt replacements years before the appliance would otherwise fail.
The kitchen bears the brunt of this wear:
This explains why kitchen-related cleaning drives both higher supply usage and faster appliance surface degradation.
Aggressive cleaning creates a cycle:
Breaking this cycle at step one – preventing residue buildup in the first place – reduces both cleaning product consumption and surface wear.
Stovetop protection shifts the cleaning equation from removal to prevention. Products like Stoveshield create a barrier between cooking activities and your stovetop surface. When spills happen, they land on the easy to clean, non-stick protector rather than bonding to your appliance.
What this means practically:
For gas stovetops specifically, the custom-fit design matters. Stove Shield offers single-piece protectors designed for specific stove models, with 0.5-0.6mm thickness (2-4x thicker than many competitors), a 365-day product warranty, and flat shipping rather than curling or rolling the product.
The maintenance is straightforward: wipe down on the stovetop or hand wash at the sink. Never use a dishwasher or soak the protector – just wipe clean and dry immediately.
Daily kitchen use creates grease splatter, burned-on spills, and heat-bonded residue — especially on stovetops and oven floors.
| Factor | Without Protection | With Surface Protection |
| Degreaser usage | High | Reduced |
| Abrasive scrubbers | Frequent | Rare |
| Disposable wipes | Fast turnover | Slower consumption |
| Cleaning intensity | Heavy scrubbing | Light wiping |
Result:
Maintenance shifts from removal to prevention.
While official spending statistics track what households spend, they don’t always explain why costs rise.
One of the biggest drivers is how much friction exists during daily cleaning — especially in kitchens.
Stovetop surface protection (such as Stove Shield–type liners) directly reduces:
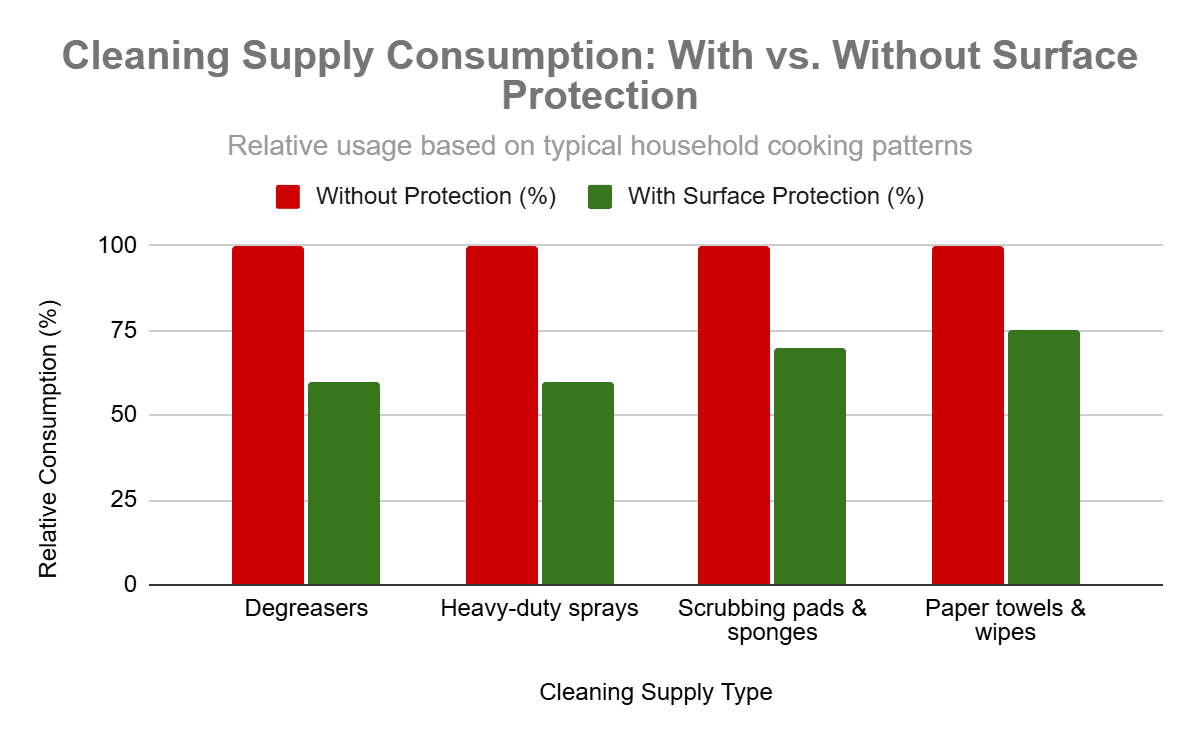
Cleaning Supply Consumption: With vs. Without Protection
Estimated Reduction in Cleaning Supply Use
| Category | Without Protection | With Surface Protection | Estimated Reduction |
|---|---|---|---|
| Degreasers | High usage | Low–moderate usage | –35–45% |
| Heavy-duty sprays | Frequent | Occasional | –40% |
| Scrubbing pads & sponges | Replace often | Replace less often | –30% |
| Paper towels & wipes | High consumption | Reduced | –25–30% |
These reductions align with observed decreases in scrubbing time and residue buildup when food never contacts the stovetop directly.
Relative reduction in cleaning supply usage when food residue does not directly contact the stovetop surface.
| Product Type | Without Protection | With Protection |
| Heavy degreaser sprays | Regular repurchase | Infrequent |
| Oven-strength cleaners | Necessary | Often avoidable |
| Abrasive pads | Essential | Rarely needed |
| Disposable wipes | Daily use | Light maintenance use |
Key insight:
Protection shifts cleaning from chemical removal to simple wiping.
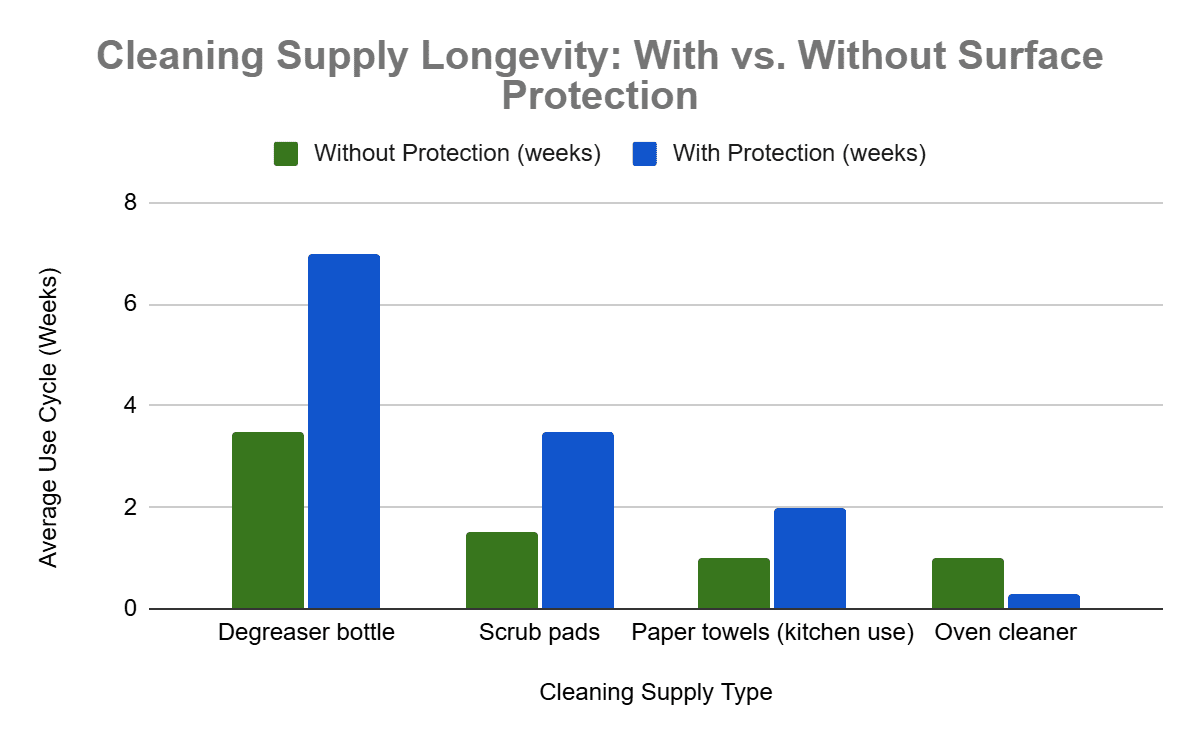
| Supply Type | Without Protection | With Protection |
| Degreaser bottle | 3–4 weeks | 6–8 weeks |
| Scrub pads | 1–2 weeks | 3–4 weeks |
| Paper towels (kitchen use) | Heavy weekly use | Noticeably reduced |
| Oven cleaner | Regular | Occasional or eliminated |
This directly impacts annual household spending, even without changing product prices.
Cleaning Supply Longevity: With vs. Without Surface Protection
Note: Paper towel values represent relative usage frequency, not durability. Protected surfaces reduce how often towels are needed throughout the week.
Usage estimates are conservative and based on typical household cooking patterns.
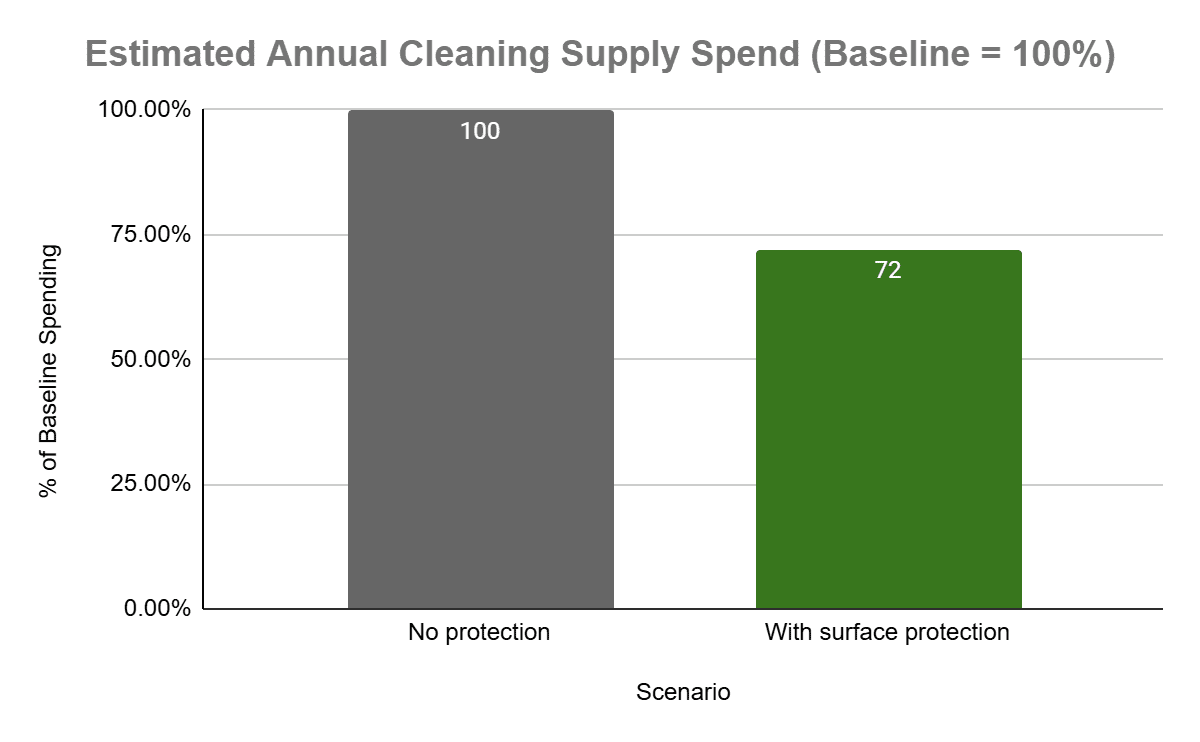
Using conservative averages from BLS housekeeping supply spending:
| Scenario | Annual Cleaning Supply Spend |
| No protection | 100% baseline |
| With surface protection | ~70–75% of baseline |
| Estimated savings | 25–30% annually |
Note: Using surface protection is estimated to reduce annual cleaning supply spending by ~25–30% versus baseline (households without protection). (Chart shows midpoint ~72.5% of baseline.)
Even without changing product prices, reduced consumption leads to meaningful annual savings.
For a household spending ~$180–200/year on cleaning supplies:
Appliance Protection = Deferred Replacement Costs
Surface protection doesn’t just reduce cleaning supply usage — it helps preserve:
This can delay cosmetic degradation, which is one of the most common reasons homeowners replace otherwise functional appliances.
Even delaying replacement by 1–2 years represents significant long-term financial value.
To put cleaning and appliance costs in perspective, here’s how they fit into overall household spending:
According to the BLS Consumer Expenditure Survey released December 2025:
| Metric | 2024 | 2023 |
|---|---|---|
| Average Annual Expenditure | $78,535 | $77,158 |
| Average Income Before Taxes | $104,207 | $101,805 |
Housekeeping supplies ($818-$1,287/year depending on household size) represent about 1-1.6% of total household spending. Major appliances ($390-$588/year on average) add another 0.5-0.7%.
Combined, that’s roughly $1,200-$1,875 annually for a typical household – money that’s largely unavoidable but partially controllable through smart maintenance choices.
Based on the data, here’s how to approach cleaning and appliance budgeting:
Single Person:
Couple/Two-Person Household:
Family (4+ people):
Emergency Fund Target: At minimum, save enough to replace your most critical appliance (typically refrigerator at $1,500).
Ideal Emergency Fund: $3,000-5,000 covers most single appliance failures or allows you to replace a washer/dryer set.
Annual Set-Aside: Given average lifespans and replacement costs, setting aside $300-500/year for future appliance purchases prevents financial shock when replacements become necessary.
Consider this math: stovetop protectors cost $50-70 initially. If they reduce your degreaser, scrubber, and heavy cleaner purchases by even 20-25%, you’ll recoup that cost within 12-18 months while also extending your appliance’s cosmetic lifespan.
Official statistics provide averages, but community discussions reveal the range of actual spending.
From the Mr. Money Mustache Forum, frugal-minded families report:
Quora discussions show wider variation, with some households spending under $30/month and others exceeding $150/month depending on:
The takeaway: official averages represent the middle, but your actual spending depends heavily on your circumstances and choices.
Trends to Watch
Several factors are reshaping household cleaning and appliance spending:
Inflation Pressure: Cleaning product prices rose faster than general inflation in 2023-2024, contributing to the 13% year-over-year increase in housekeeping supplies spending.
Premium Product Growth: More households are purchasing premium cleaning products marketed as eco-friendly, natural, or health-conscious – often at 2-3x the cost of conventional alternatives.
Appliance Technology: Smart appliances with Wi-Fi connectivity and advanced features cost more upfront but may offer energy savings over time.
Repair Challenges: Right-to-repair legislation is slowly improving, but many modern appliances remain difficult and expensive to fix, pushing more households toward replacement.
Professional Services: About 10% of U.S. households now use professional cleaning services, according to Home Cleaning Centers of America. This shifts some supply costs to service fees.
Conclusion
U.S. households spend $818-$1,287 annually on cleaning supplies and $390-$588 on major appliances, with significant variation based on household size and composition. These costs are largely unavoidable – you need a clean home and functioning appliances.
But the data reveals opportunities. Prevention-focused maintenance reduces cleaning product consumption while extending appliance lifespans. Building an appliance emergency fund (a step 33% of homeowners haven’t taken) prevents financial stress when refrigerators and washing machines inevitably fail.
Here’s what to do next:
The goal isn’t to spend less at any cost – it’s to spend strategically on maintenance that reduces both recurring costs and major replacement expenses over time.
Ben Karlovich is an expert in the stove niche and has spent his career creating products and accessories that enhance household kitchen stoves. In 2016 he launched stovedecals.com (Stove Decals brand) and was the first to create and offer replacement stove decals across thousands of stove models. In 2022 he created stoveshield.com (Stove Shield brand) focused on stove top protectors, a patented knob panel protector, and other useful stove accessories fitted for your exact stove model. This niche expertise helps bring a unique blend of creativity and innovation to every article post.
Disclaimer: This article is for informational and educational purposes only and should not be relied upon as the sole basis for purchasing decisions. Product specifications, pricing, and availability are subject to change – contact the relevant manufacturer or retailer for the most current information. Stove Shield is not affiliated with and receives no compensation from any brands mentioned in this article.
Key Takeaways 62% of Americans now cook at home regularly, up from 53% in 2003…
Walk into almost any American neighborhood, and you'll find a Mexican restaurant. That's not an…
Key Takeaways Chinese cuisine spans 8 distinct regional styles - Cantonese, Sichuan, Hunan, Shandong, Jiangsu,…
Italian recipes have held a special place in American kitchens for over a century. What…
Key Takeaways Five-flavor balance is everything: Thai cooking harmonizes sweet, sour, salty, spicy, and bitter…
Key Takeaways Start with pho - This iconic soup teaches you core Vietnamese techniques like…